The Home Tab
The Home Tab
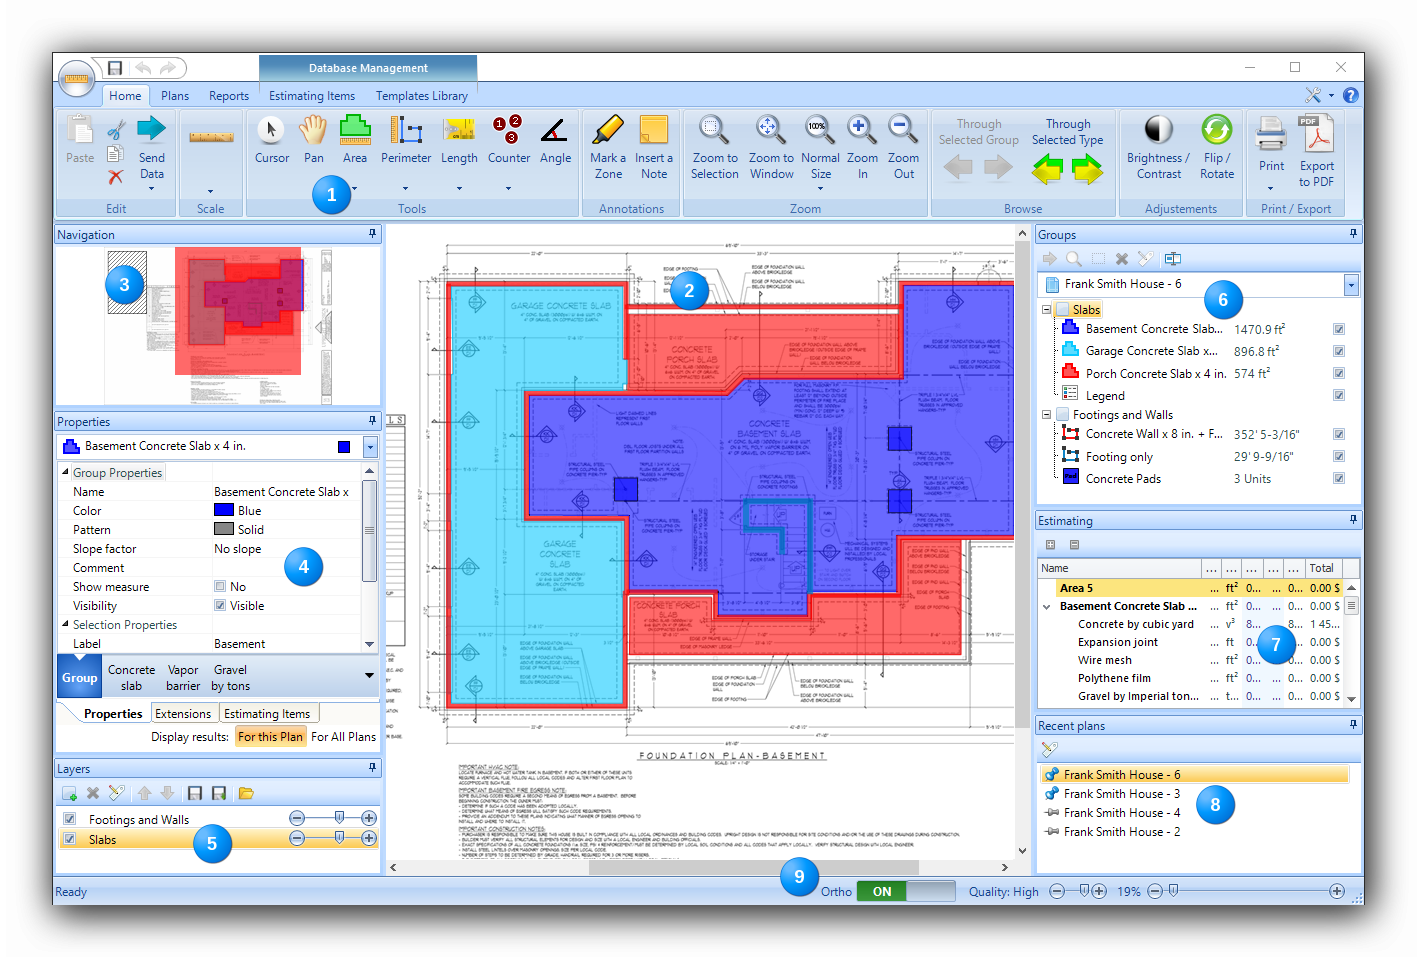
The Home tab is the first tab of the ribbon. Here, we find all measuring and plan image manipulating functions.
|
|
The Home tab is the first tab in the ribbon. Here, we find all measuring and plan image manipulating functions. The ribbon contains editing, scale, measuring, annotation, zoom, browse, image adjustment and printing tools functions. |

|
|
The canvas is located in the center of the interface. It is on the canvas that all the measurements are traced with the mouse. It can be widened by docking the panels at the left and right. All the tools in the Home tab have an effect on the canvas. |

|
|
The Navigation panel and the miniature of the current plan. The miniature plan found in the Navigation panel shows an overview of all the elements inserted on the plan. The red area on the miniature shows the visible area displayed in the canvas. This red area can be larger or smaller depending on the setting of the zoom factor. To navigate on the plan, the user can move the red area on the miniature with the mouse or click on the center of the area to display on the miniature. The selected area will be automatically adjusted on the canvas according th the selected area in the miniature. |

|
|
The Properties panel. If an object or a group of objects exists on the canvas, The Properties panel displays its associated values. Each type of object has a specific set of properties. The user can select an object to set focus on by selecting the object in the drop-down menu at the top of the panel. If an object is selected with the mouse on the canvas, the properties of this object will be automatically loaded in the Properties panel. In this panel, a user can modify :
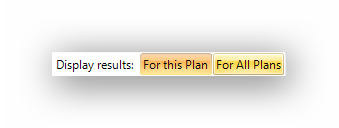
Comments can also be added to each group of objects. Please note that the items displayed in the "Results" part of the grid are not modifiable because they reflect data generated by the objects on the canvas. At the bottom of the Properties panel are two (2) tabs which display the object's properties and its associated extensions. Each measured object can be associated with one or more extensions that add a layer of results to any given measurement. The extensions are tied to building methods and to trades. The user will find, for example, a "Drywall" group of extensions including individual extensions such as "Ceiling Drywall", "Outside Wall Drywall" and "Partition Drywall". Each extension is associated to a measuring tool which allows for its best use. This way, the "Ceiling Drywall" extension is associated with the "Area" tool. Once an extension is associated with a measuring tool, the user can browse through the results of the extension and edit its parameters. At this level, the user can also add or remove extensions associated with a measuring tool. The "Display results" buttons.
At the bottom of the Properties panel, are two (2) buttons allowing the modification of the results in the results grid. As an object or a group of objects can be found on many plans, the user can display the results for the current plan only (For this Plan) or for all occurrences of this object on all the plans (For All Plans). Modifying this parameter will not affect the results in the "Groups" panel, on the right-hand side of the interface. The "Groups" panel will display the results for the active plan only. |

|
|
The Layer panel. The Layers are much like glass-panes that can be added on the canvas. Each loaded plan has a "Default Layer" on which objects can be added. The layers allow for dividing by "coats" the desired measured objects. Six functions let the user add a layer, delete a layer, rename a layer and three more are for saving and opening a predefined list of layers. Please note that objects of a same group cannot be divided on separate layers on the same plan. The layers are a way to classify the objects in the report. |

|
|
The Groups panel. The Groups panel is located on the right-hand side of the canvas. It displays all object groups present on the canvas in a tree view according to their position in each layer of the plan. For each object group, the panel displays the associated tool, the output result, its colour and its visibility on the canvas. For each object group, in the Groups panel, the user can :
At the top of the Groups panel, we find five (5) tools allowing to :
|

|
|
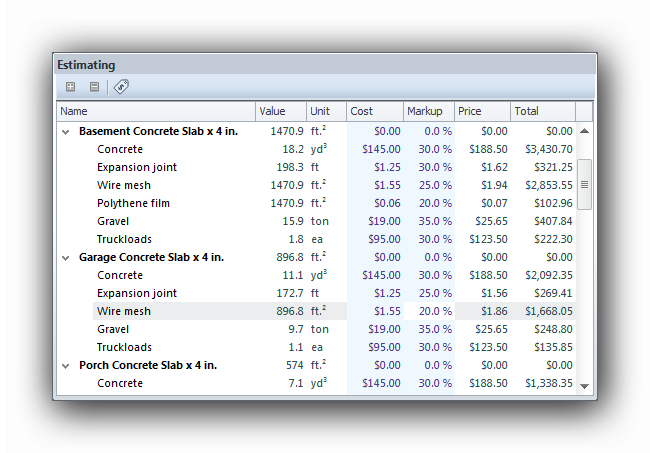
The "Estimating" panel. This panel allows the user to enter prices for each measured object. If one or many extensions are associated with the measured object, the items generated by the extensions will also be represented in this grid. The price information entered in the grid will be reflected in the "Estimating" report in the "Report" tab.
|
|
|
The Recent plans panel. Once a plan has been loaded for editinf in the Plans tab, it becomes available in the Recent plans panel. Hovering on a plan name with the mouse will display its miniature. The user can switch form a plan page to another without going back to the Plans tab. For the frequently used plan pages, click on the pin to attach the plan at the top of the list. |


|
|
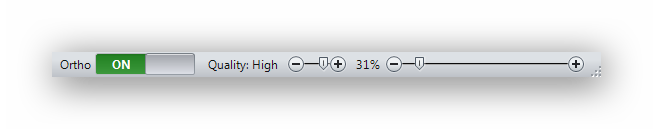
The status bar informs the user of the status of the project. It also contains three (3) tools :
|

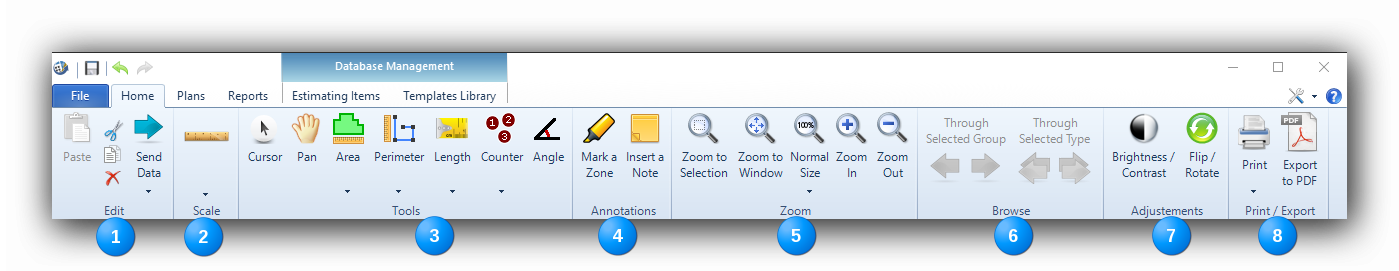
The Home tab Ribbon.
|
|
The Edit functions : The measuring entries on the canvas are objects which are classified in object groups. The user can use the well known Windows functions to manipulate the objects such as : Copy, cut, paste, undo and redo. |
|
|
The Scale button allows for a scale ratio adjustment in three ways : In Metric format, in Imperial (US) format or by manually adjusting the scale with a reference measurement on a plan page. The small black arrow next (or under) to the button lets the user switch the measuring system (Metric and Imperial) and to modulate the accuracy (decimals) of the measure outputs. |
|
|
The measuring Tools. Active Takeoff offers seven (7) tools to create and manipulate output results.
|
|
|
The Annotation functions This panel contains 2 buttons The "Mark a Zone" button draws a highlighted rectangular area on the plan. The marking of the area is performed with the mouse by stretching the area from a corner to the other while holding down the left button of the mouse.
|
|
|
The Zoom Functions This panel contains 5 buttons
|
|
|
The "Browse" functions This panel contains 2 buttons The "Through Selected Group" button navigates through all the occurrences of items of a group present on the canvas. The button displays each of the group item optimally centered and zoomed with each click. The "Through Selected Type" button navigates through all the occurrences of items of a type present on the canvas. The button displays each of the type item optimally centered and zoomed with each click. |
|
|
The "Adjustments" functions This panel contains 2 buttons The "Brightness / Contrast" button adjusts the visual quality of a plan by modulating the brightness and contrast rates of an image on the canvas. The "Flip / Rotate" button manipulates the image by rotating it by 90 degree increments, clockwise or counter-clockwise. Mirror images can also be obtained with the horizontal and vertical mirror functions. |
|
|
The "Print" and "Export to PDF" buttons. Sends the visual contents of the canvas to the printer of your choice (paper or PDF). |
See also :
Select Functions in Contextual Menus